We all want to help protect the environment. When it comes to making eco-friendly choices, we need a sustainable routine that sticks.
Check out the sustainability statistics below to learn more about how our efforts are impacting the world and the habits that can help make a difference.
What Are the 4 Types of Sustainability?
There are four main types of sustainability — human, environmental, social, and economic. Sustainability is separated into four pillars to break up the main problems and goals in each sector, leading to more concrete steps to a better world.

Key Sustainability Facts and Figures
When looking at our planet’s sustainability efforts, it’s important to look at the data. Below are some statistics on how consumers, countries, and businesses are doing their part to improve our world.
- 67% of our shoppers said they’re aware of environmental responsibility, while 19% are extremely committed to the practice. (Hive Brands)
- 93% of the world’s 250 largest companies report on sustainability. (UN Sustainable Development Goals Report)
- 100+ countries have policies on sustainable consumption and production. (UN Sustainable Development Goals Report)
- In 2017, renewable energy made up 17% of the world’s energy consumption. (UN Sustainable Development Goals Report)
- The net per-capita landfill rate dropped from 3.2 to 2.4 pounds from 1990 to 2018. (EPA Advancing Sustainable Materials Management)
- Consumers believe the five most important sustainable practices are waste reduction, reducing carbon footprint, sustainable packaging, ethical working conditions, and respect of human rights. (Deloitte)
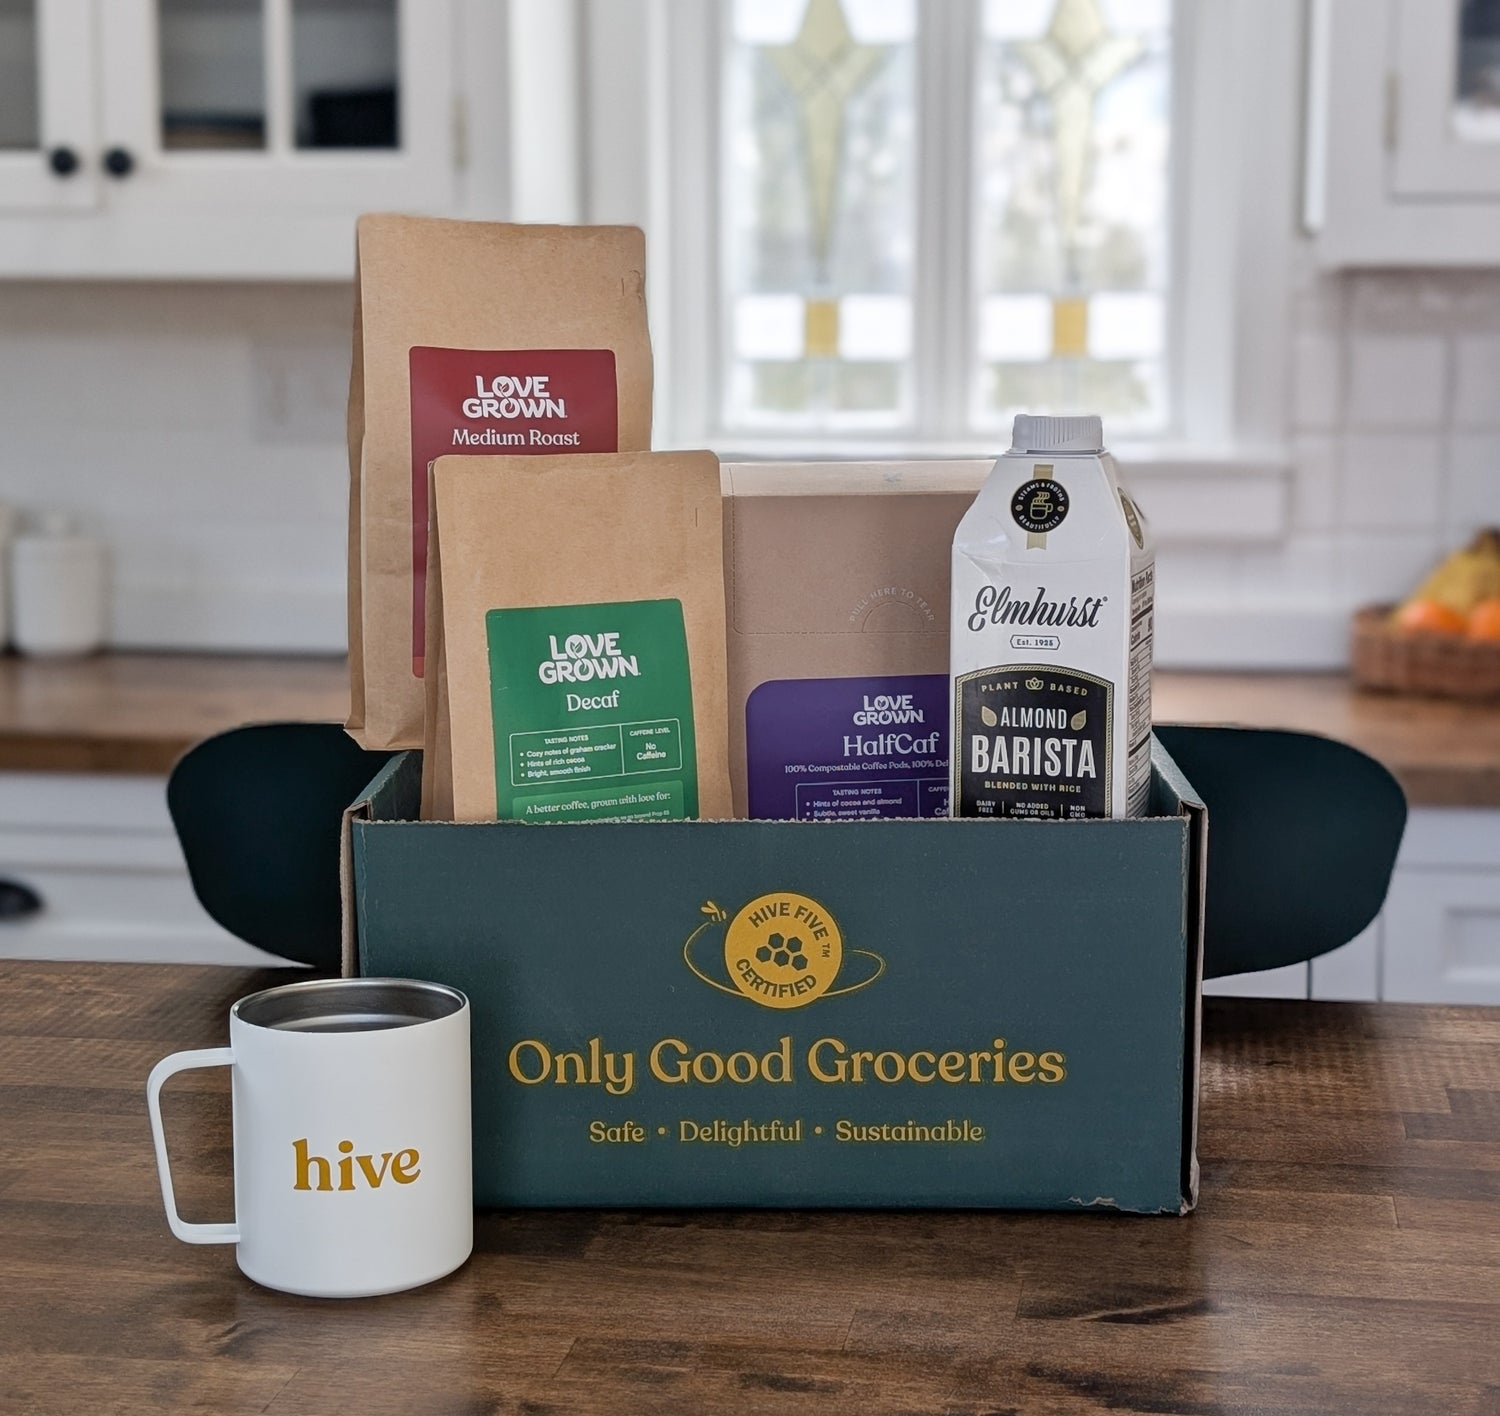
Environmentally Friendly Packaging Statistics
Here at Hive, environmentally friendly packaging is kind of our thing. That’s why we offer so many great zero-waste and refillable products. Learn how environmentally friendly packaging is impacting (or could impact) our world below.
- Over half of all containers and packaging generated are made from paper products. (EPA Advancing Sustainable Materials Management)
- Of the 41.9 million tons of paper containers generated, 80.9% are recycled. (EPA Advancing Sustainable Materials Management)
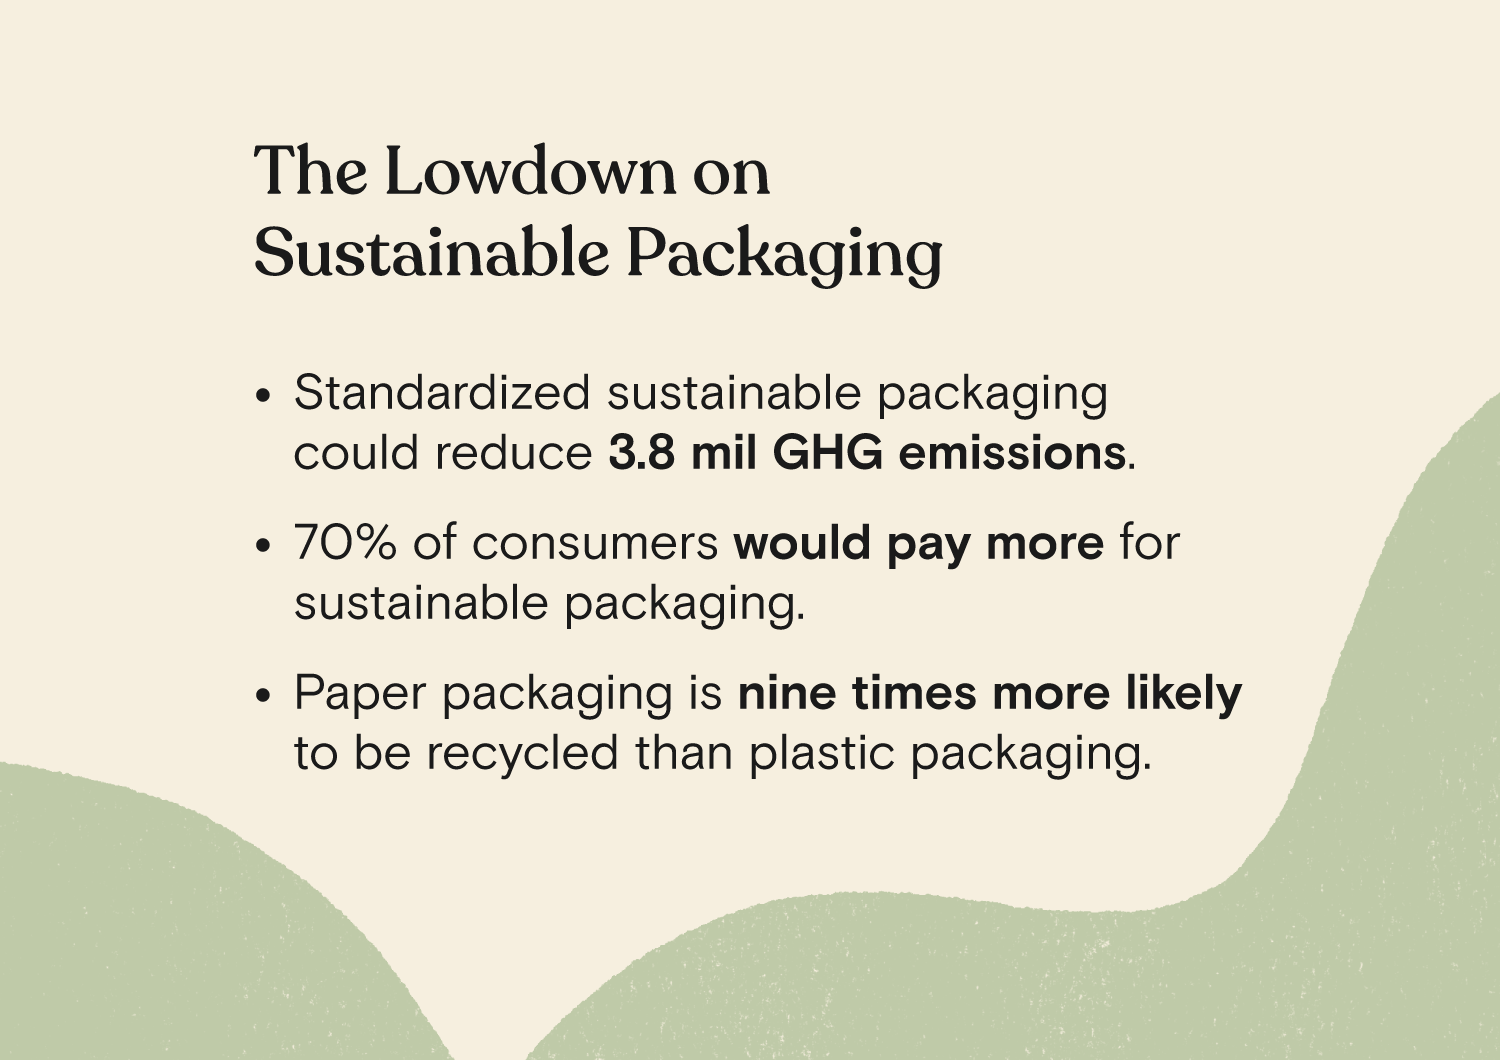
- Sustainable packaging design could reduce 3.8 million greenhouse gas emissions. (ReFED)
- 69% of consumers say that sustainable packaging is the most important practice. (Deloitte)
- 64% of consumers said they are looking for better ways to reduce their plastic packaging usage. (Deloitte)
- 70% of consumers are willing to pay more for sustainable packaging. (Trivium Packaging)
- 67% of consumers say it's important to buy products that are recyclable, while 64% said the same about packaging made with recycled materials. (Trivium Packaging)
Plastic Statistics
We all know plastic is a problem. But outside of recycling and buying zero waste, what more can we do? To learn more about how to reduce plastic waste, check out our guide. And to see exactly how plastic is harming our planet, take a look at the statistics below.
- Only 8.7% of plastic created is recycled, while 75.5% ends up in landfills. (EPA Advancing Sustainable Materials Management)
- 500 million plastic straws are used every single day. (National Geographic)
- 61% of consumers said they reduced the amount of single-use plastic they used from 2020 to 2021. (Deloitte)
- In 2018, over 14 million tons of plastic materials were created. (EPA)
- 40% of plastic produced worldwide is for packaging. (National Geographic)
- Plastic is the second most common item sent to landfills. (EPA)
Sustainable Living Statistics
From barriers to entry to how sustainable living efforts have changed over time, below are sustainable living statistics you should know.
- 46% of respondents said they’re doing all they can to live more sustainably. (Statista)
- Meanwhile, 48% said they’re making some effort, but could do more. (Statista)
- In 2022, consumers are 26% more likely to buy from sustainable sources than they were in 2020. (NielsenIQ)
- Millennials are twice as likely as baby boomers to change habits to reduce their environmental impact. (NielsenIQ)
- 70% of consumers said they would pay more for brands that are environmentally responsible. (IBM)
- The barriers to entry for sustainable living are lack of interest (22%), price (16%), and lack of information (15%). (Deloitte)
Food Waste and Repurposing Statistics
Food waste is a growing problem. And while there are many brands working to help counteract the negative effects of wasted food (hello, upcycled food!), it’s important to stay educated on why reducing food waste matters.

- One-third of all food produced goes to waste, either through spoiling or rotting. (United Nations)
- 13.8% of all food is lost in supply chains. (UN Sustainable Development Goals Report)
- Out of 63,130,000 tons of food generated in the U.S. in 2018, 2,590,000 tons were composted. (EPA: Food: Material-Specific Data)
- The percent of food recycled or composted has grown 15.2% from 1990 to 2018. (EPA Advancing Sustainable Materials Management)
- In 2019, 35% of food went unsold or uneaten in the U.S. (ReFED)
- Centralized composting could divert over 13.8 million tons of food waste. (ReFED)
Water Usage Statistics
Access to clean drinking water may seem like a given, but in reality, that’s not always the case. The following water usage statistics will help shed light on what we use water for and how easily accessible it really is.
- 59% of all domestic wastewater is safely treated. (UN Sustainable Development Goals Report)
- Uneaten food wastes 14% of freshwater resources. (ReFED)
- Water use is rising by 1% each year. (UN Water)
- Nearly half the population lives in areas that are water-scarce one month a year. (UNESDOC)
- The Food and Agriculture Organization of the UN has estimated a 5.5% increase in water withdrawals from 2008 to 2050. (UNESDOC)
- Agriculture uses up to 70% of our global freshwater supply. (UNESDOC)
Fair and Direct Trade Statistics
Fair trade puts people first, both through improved working conditions and ethical practices. But just because it’s people-first doesn’t mean it's not helpful for the environment. Learn more about the fair and direct trade industry below.
- In 2018, the global population spent the equivalent of $11.1 billion on fair trade products. (Statista)
- Food products with ethical labels are valued at $231 billion in 2020. (Statista)
- 65% of consumers said they would be more likely to buy a product if it’s listed as fair trade. (Statista)
- There are 1,880 fair trade-certified organizations worldwide. (Fairtrade Foundation)
- Fair trade products were sold in 145 countries in 2019. (Fairtrade International)
Climate Change Statistics
See how our climate is expected to change in the next few decades by reading through the stats below. And if you read these and want to start making changes, check out the brands we work with that are putting the environment first!
- Coastal eutrophication is expected to increase by 20% in large marine ecosystems by 2050. (UN Sustainable Development Goals Report)
- 60-70% of the world’s ecosystems are degrading faster than they can recover. (World Bank Group)
- Water scarcity could displace over 700 million people by 2030. (UN Sustainable Development Goals Report)
- Global temperatures are estimated to rise by 3.2 degrees Celsius by 2100. (UN Sustainable Development Goals Report)
- 2016 and 2020 are tied for the warmest years on record. (NASA - Global Climate Change)
- Global sea levels have risen eight inches in the last century. (NASA - Global Climate Change)
Sustainability and the Future
While some statistics leave you feeling grim about the state of the world, we like to focus on what is going right. Looking forward, consumers and companies are setting valuable goals and making climate-friendly changes for a better world. Below are just a few of the sustainability stats that will lead to a brighter future.

- The World Bank Group is increasing climate financing to 35% of total commitments by 2026. (World Bank Group)
- They will also provide $25 billion in annual climate financing between 2021 and 2025. (World Bank Group)
- If the world switched to sustainable practices, we could save $26 trillion by 2030. (The New Climate Economy)
- The ozone layer is expected to return to its 1980 thickness in the next 55 years. (The World Counts)
- There are over 20 cities in the Carbon Neutral Cities Alliance, who are aiming to minimize GHG emissions by 80% by 2050. (CNCA)
- One-third of Europe’s largest companies have pledged to reach net-zero emissions by 2050. (Accenture)
- Currently, only 9% of companies are on track to meet this goal. (Accenture)
Want to do more to impact change? You can always start by shopping at a sustainable grocery store like Hive. We’re kinda experts in that area.